

MBA FPX 5008 Assessment 3 Applying Analytic Techniques to Business
Student Name
Capella University
MBA-FPX5008 Applied Business Analytics
Prof. Name
Date
Starbucks Corporation
Starbucks is the undisputed global leader in specialty coffee. The coffee giant operates nearly 30,000 locations worldwide and has demonstrated strong financial earnings and consistent growth, reaching a record net revenue of $24.7 billion in 2018.
For the first time in the US, gourmet coffee has a 60/40 advantage over traditional non-gourmet coffee (Brown, 2019). The US coffee market is estimated to be $48 billion, with the specialty market comprising 55% of the value share. Growth is forecasted at 5.5% annually over the next five years, with the industry having the potential to reach $75 billion in revenue (Menke, 2018).
While Starbucks’ success has been focused on coffee, the company has found strategic growth by acquiring brands such as Teavana, Bay Breads, and Evolution Fresh Juices, providing continued avenues for marketplace excellence. Starbucks operates company-oriented stores and joint ventures in international markets instead of following traditional franchise models. In 2017, 79% of Starbucks’ revenue came from the 49% of company-operated stores, while licensed stores, though more numerous, accounted for just 11% of total revenue (Cuofano, 2019).
Expanding operations into key developed and emerging markets has been highly successful for Starbucks, which now spans 78 countries. The two largest markets are the United States, accounting for 7% of growth, and China, with 6% growth in 2018 (Wiener-Bronner, 2019). Starbucks intends to continue international expansion by opening an additional 500 stores in China by the end of 2019.
Graphical Representation of Data
Interpreting the Histograms
Figure 1. Histogram of total volume of securities traded (Yahoo Finance, 2019)
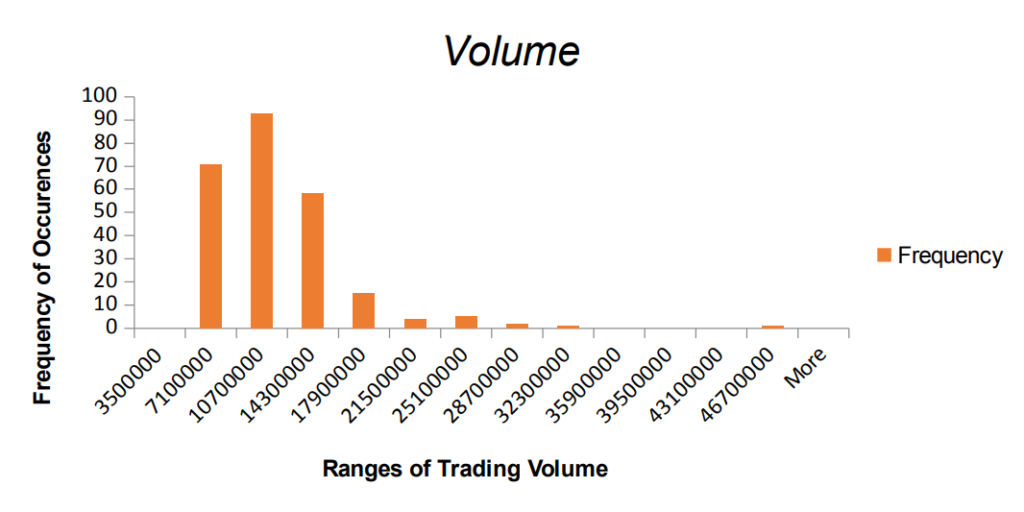
Figure 1 represents the volume of Starbucks stock bought or sold daily from September 17, 2018, to September 13, 2019. The x-axis shows the range of Starbucks stock volume, and the y-axis represents the number of occurrences of the stock volume falling into each range. The right side of the graph shows that most data points fall between 7,100,000 and 14,300,000. The relationship between the mean and median, with a mean greater than the median, indicates that the graph is skewed right. Skewed-right histograms have a few large values that drive the mean upward but do not affect the exact middle of the data. With most data points falling in the lower range of stock volumes and the presence of extreme high-volume outliers, this indicates an unequal distribution, making it difficult to speculate on Starbucks’ daily stock volumes.
Figure 2. Histogram of closing stock prices adjusted after market close (Yahoo Finance, 2019)
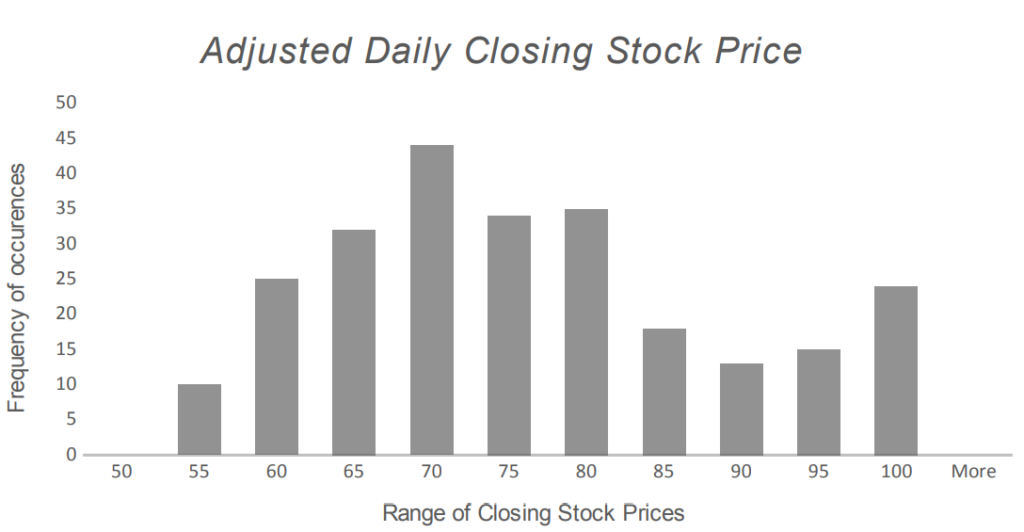
Figure 2 represents the daily adjusted closing stock prices from September 17, 2018, to September 13, 2019. The x-axis shows the range of adjusted closing stock prices for Starbucks, and the y-axis represents the number of occurrences of prices falling in each range. In this graph, the mean and median are close, but the mean is slightly higher at 73.72 compared to 70.88, indicating the graph is skewed to the right. The trend of increasing closing cost occurrences with larger values drives the mean upward but has not yet affected the exact middle of the data. As the closing prices continue to rise, the mean will eventually fall below the median, skewing the range in the opposite direction.
Interpreting the Scatterplots
Figure 3. Scatterplot of highest stock prices of Starbucks (Yahoo Finance, 2019)
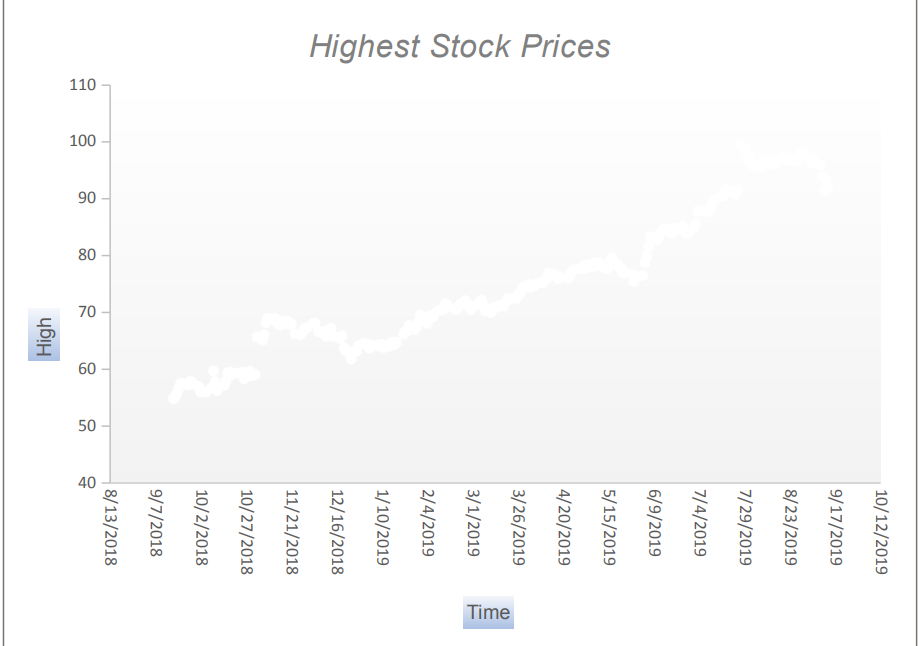
Figure 3 depicts the trend in the highest stock prices of Starbucks from September 17, 2018, to September 13, 2019. This graph explains the relationship between the dependent variable of the highest stock prices for Starbucks on the y-axis and the independent variable of time on the x-axis. The graph shows a positive relationship between price and time. The stock rose 44% to a peak in July, pausing only once in May with a retreat to the 10-week moving average (Whitfield, 2019). Over the year, the stock price showed a steady increase until the very end of the year, where there was a slight decrease in the last month.
Figure 4. Scatterplot of lowest stock prices of Starbucks (Yahoo Finance, 2019)
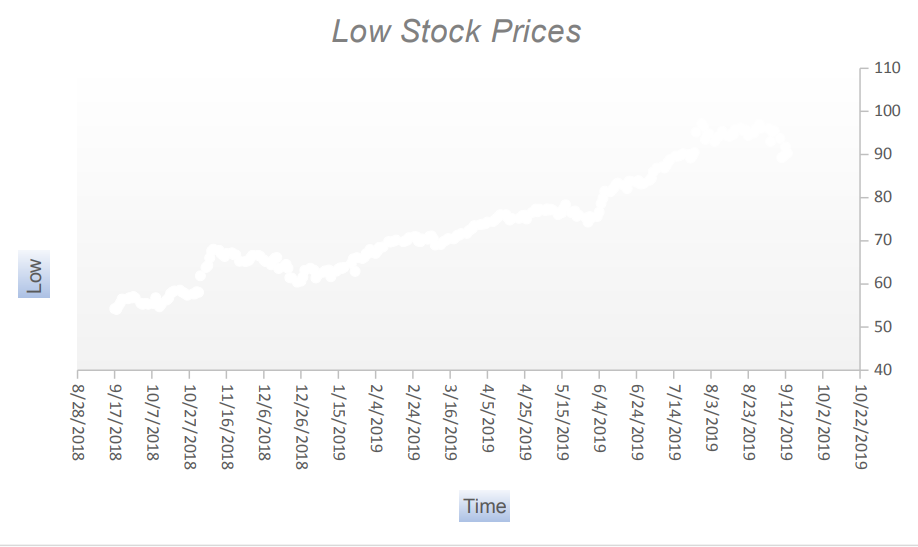
Figure 4 depicts the trend in Starbucks’ lowest stock prices from September 17, 2018, to September 13, 2019. The graph shows the relationship between the dependent variable of the lowest stock price for Starbucks on the y-axis and the independent variable of time on the x-axis. The graph shows a positive relationship between price and time. Over the year, the low stock price mirrored the steady increase seen in high stock prices, with the same decrease at the end of the month as seen in Figure 3.
Descriptive Statistics
Mean, Median, and Standard Deviation of Adjusted Closing Stock Prices
Finding the mean value of the data set for Starbucks Corporation’s adjusted closing stock prices involves adding each daily value together and dividing it by the total number of days. The average price from September 17, 2018, to September 13, 2019, was $73.72. Daily fluctuations in cost due to rising or falling markets often result in a stock’s actual price being near the analysts’ estimated value. Finding the mean value over time helps determine if there is stable growth and profit in a stock when compared to starting and ending values.
The median corresponds with the data point in the middle of the data set. The median closing stock price for Starbucks was $70.88. When the median price is lower than the mean, as with Starbucks, it indicates the presence of high-end outliers, reflecting fluctuations in the market price of Starbucks stock.
Standard deviation measures uncertainty and can determine volatility in stock pricing. The standard deviation of 12.5 for the adjusted closing stock price for Starbucks indicates how far stock prices spread out from the average. Starbucks has a relatively small standard deviation, suggesting most adjusted stock prices are close to the 72.73 average, but it also indicates some risk in purchasing Starbucks shares.
Mean, Median, and Standard Deviation of Daily Traded Stock Volume
Starbucks’ mean daily trading volume from September 17, 2018, to September 13, 2019, was 10,030,024, indicating a large volume of stocks trading during this period. Large trading volumes suggest increased interest in the stock, showing emotional excitement and a large pool of prospective buyers.
The median stock volume is 9,223,100, which is less than the mean, indicating the presence of high-volume outliers in the data set. Starbucks’ available trading volume is inconsistent, showing significant spikes in daily trade volume. This inconsistency is noted in the standard deviation of 4,876,760, representing high volatility in the data and frequent changes in available stock volume on the market.
Conclusion
The graphical representation of both high and low stock pricing showed a steady and consistent price increase over time. Starbucks has a healthy market standing and is positioned to continue increasing profits as it grows its market share. Using a disciplined expansion of its global store base, including adding more stores in proven markets in the U.S. and expanding more aggressively in higher-growth markets like China, would allow for steady profits and stock growth (Ekstein, 2019).
The trade war threat between the US and China likely caused the slight downward movement in stock prices at the end of the data set. Starbucks has 3,400 outlets in China and saw same-store sales slip 2% in the last quarter, versus 7% growth in the previous year. Growing anti-US sentiment among Chinese consumers, fueled by the escalating trade war, threatens to harm Starbucks’ continued market growth (Moon, 2018).
Bad news from the industry will increase the company’s stock volatility. Starbucks already has high volatility in stock volume, but issues with the production of high-quality coffee beans and decreased availability of products can multiply market volatility and reduce interest in purchasing market shares. Changing climates are driving significant volatility in coffee prices, challenging farmers who often lack access to risk management tools.
MBA FPX 5008 Assessment 3 Applying Analytic Techniques to Business
The adjusted closing price provides a more accurate reflection of a stock’s value, as distributions and new offerings can alter the closing price. Starbucks pays investors quarterly dividends of thirty-six cents per share. While welcomed by shareholders, these dividends lower each share’s value. Profits are being disbursed to shareholders instead of reinvested into growing the company, which is seen as devaluing the company (Ganti, 2019).
Analyzing stock trends and using statistical data will help direct marketing, sales, and business decisions for Starbucks. Data is key to Starbucks and supports its pricing strategy, real estate development planning, product development, trade promotion optimization, and marketing strategy. The company’s net sales rose 8% to $6.82 billion, topping expectations of $6.67 billion last year (Shama, 2019). This, along with continuous growth noted in the graphical data, should give investors continued confidence in the company’s growth.
References
Brown, N. (2019, March 11). 2019 coffee and beverage trends: Inside the NCA’s annual report. Daily Coffee News. Retrieved from https://dailycoffeenews.com/2019/03/11/2019-coffee-and-beverage-trends-inside-the-ncas-annual-report/
Cuofano, G. (2019). Starbucks business model in a nutshell. Four Week MBA. Retrieved from https://fourweekmba.com/starbucks-business-model/
Eckstein, J. (2019, September 24). How Starbucks makes money. Investopedia. Retrieved from https://www.investopedia.com/articles/markets/021316/how-starbucks-makes-moneysbux.asp
Ganti, A. (2019, April
23). Stock dividend. Investopedia. Retrieved from https://www.investopedia.com/terms/s/stockdividend.asp
Menke, J. (2018). The state of the specialty coffee industry. Specialty Coffee Association. Retrieved from https://sca.coffee/sca-news/an-insider-look-at-the-state-of-the-specialty-coffee-industry-in-2018
Moon, L. (2018, July 26). Trade war threatens Starbucks’ success in China. Business Insider. Retrieved from https://www.businessinsider.com/trade-war-threatens-starbucks-success-in-china-2018-7
Shama, G. (2019, April 25). Starbucks’ Q2 revenue growth tops expectations. MarketWatch. Retrieved from https://www.marketwatch.com/story/starbucks-q2-revenue-growth-tops-expectations-2019-04-25
MBA FPX 5008 Assessment 3 Applying Analytic Techniques to Business
Whitfield, G. (2019, January 10). Starbucks stock rallies for 2019. Zacks. Retrieved from https://www.zacks.com/stock/news/352051/starbucks-stock-rallies-for-2019