BUS FPX 4014 Assessment 5 Inventory and Ordering Decisions
Student Name
Capella University
BUS-FPX4014 Operations Management for Competitive Advantage
Prof. Name
Date
Question #1
Calculate and provide the numeric monthly aggregate production rate rounded to a whole number. The level production rate is the total units per period. The formula for the Aggregate Production Rate (APR) is:
APR=M(D1+D2+D3+D4+D5+D6−SI+EI)
Given:
- Six-Month Demand (= 1,535)
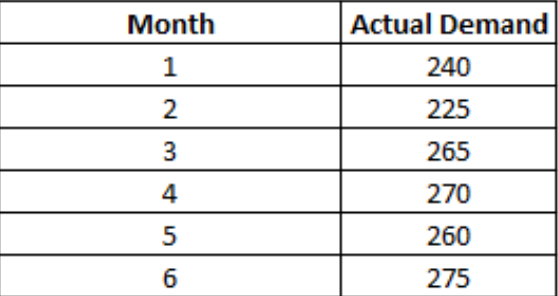
- Period 1 (= 240)
- Period 2 (= 225)
- Period 3 (= 265)
- Period 4 (= 270)
- Period 5 (= 260)
- Period 6 (= 275)
Net Requirement (= 1,535 + 50 – 150 = 1,435)
Monthly APR =(240+225+265+270+260+275−150+50)6=239
(rounded).
Question #2
What is the equation for the number of workers needed to meet the aggregate production rate?
4831=1.6 units a day per worker. 23131=7.45 units a day. 7.451.6=4.66 daily workers. 4.66×31=145 workers needed to produce 231 units in one month.
Question #3
Provide the algebraic equation for the economic order quantity rounded to the closest whole number.
���=(2×10×54002)=54,000 54,000=232
Question #4
Provide the algebraic equation for the reorder point.
��=22×5 ��=110
Question #5
Describe the below forecasting methods and the math associated with each method, along with the pros and cons of using it.
Naïve
- Estimating technique used as a comparison without adjusting.
- Pro: Easy, quick, benchmarking.
- Con: Accuracy, cannot forecast turning points.
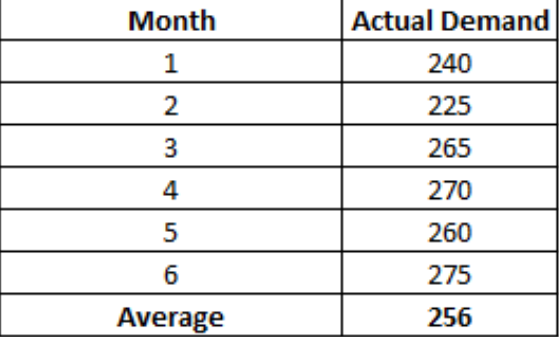
Simple Mean
- An average of all available data.
- Pro: Easy to calculate, easy to use for patterns.
- Con: No actual value, as only averages provided.
Simple Moving Average
- Takes recent actual values and then averages them.
- Pro: Easy to calculate and understand.
- Con: All values are calculated equally.

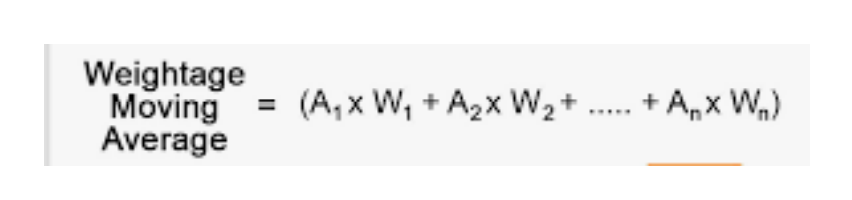
Weighted Moving Average
- Recent values are given more weight in calculating the forecast.
- Pro: Reflective upon updated data.
- Con: Complex calculations required.
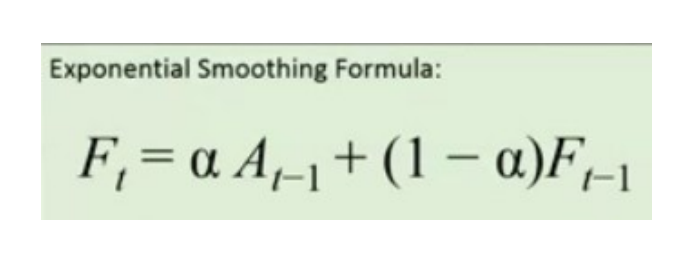
Exponential Smoothing
- Recent data with more weight.
- Pro: More weight within updated data.
- Con: Data includes potentially unnecessary data impacting total forecast.
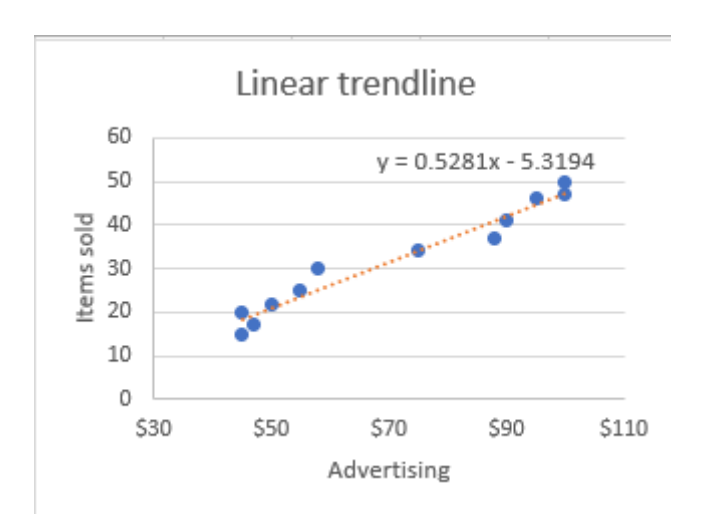
Linear Trend Line
- Straight line through a set of data through time series.
- Pro: Multiple statistics can be added.
- Con: Too much data with one independent variable.