MBA FPX 5010 Assessment 3 Performance Evaluation – Ace Company
Student Name
Capella University
MBA-FPX5010 Accounting Methods for Leaders
Prof. Name
Date
Ace Company Performance Evaluation
Executive Summary
Ace Company has requested a $3 million loan, repayable over ten years, to finance the purchase of production equipment and design software. This evaluation considers the company’s accounts receivable collections, inventory turnover, and short- and long-term creditworthiness to assist in the decision-making process regarding the loan approval.
Accounts Receivable Collections
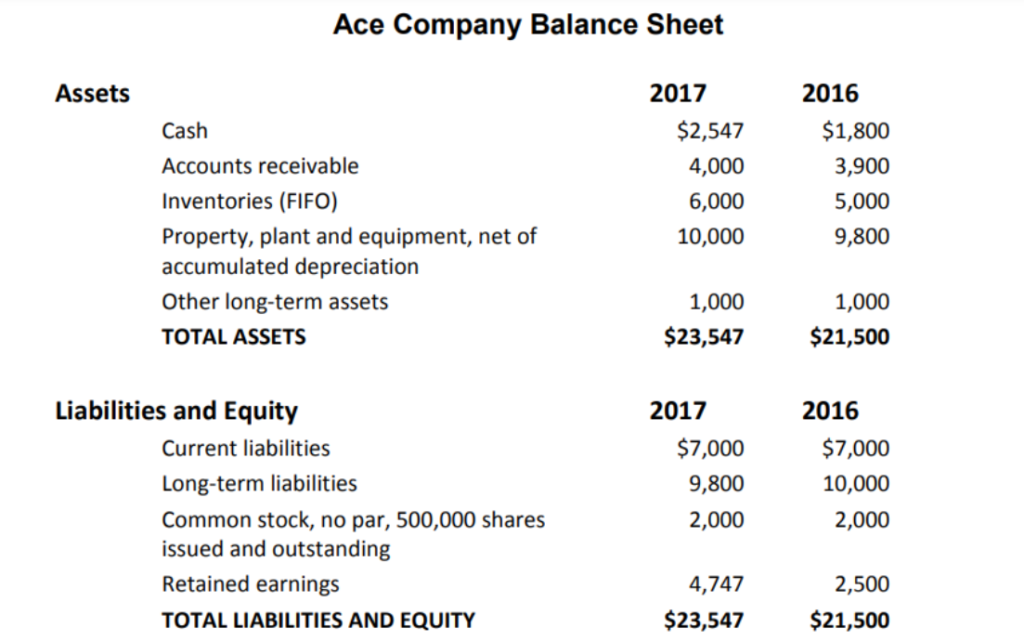
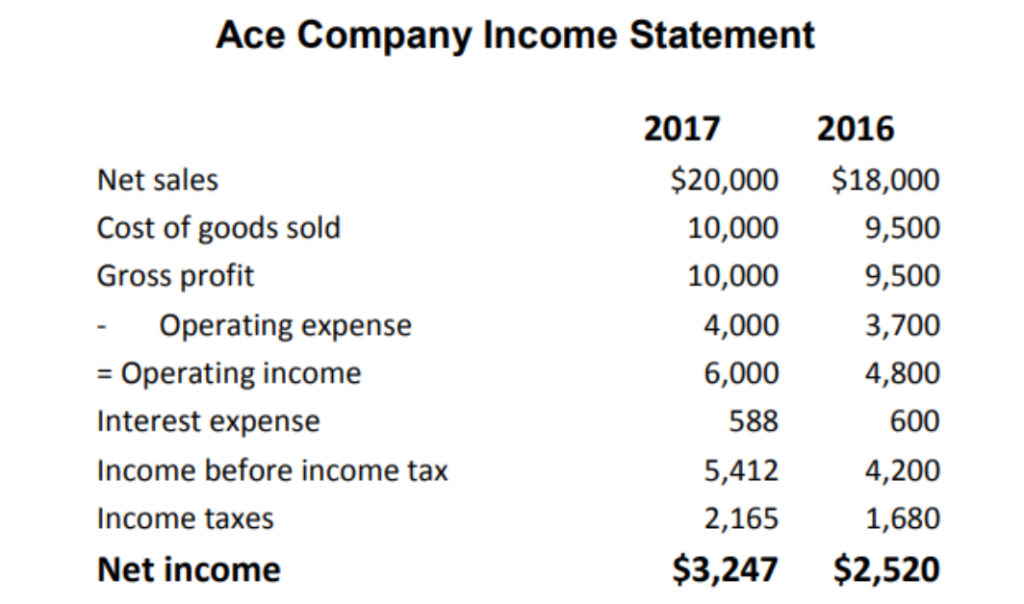
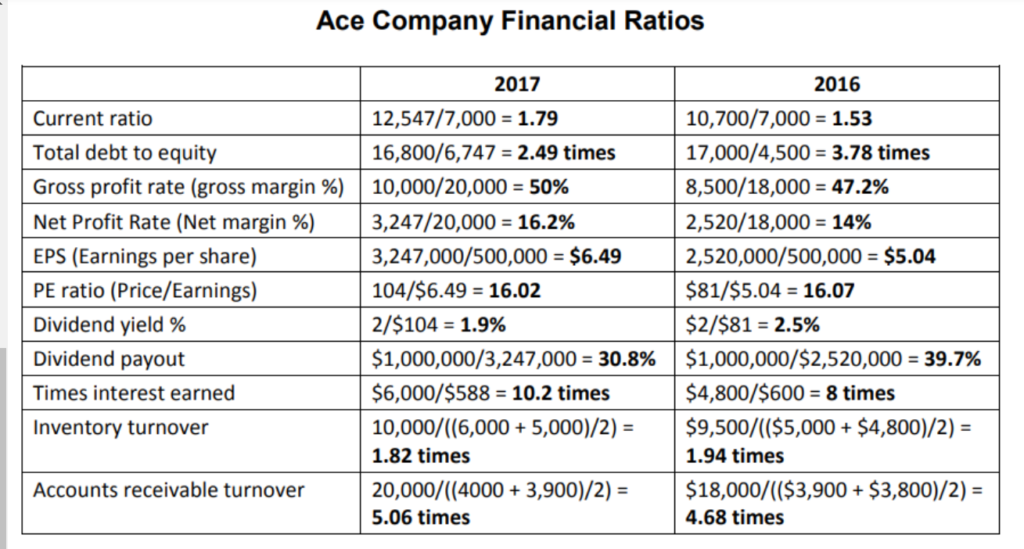
Accounts receivable (AR) represents the money owed to a company for goods or services sold that have not yet been paid by the customer but are due within a specific period after the sale (Marshall, 2020). The AR data provided by Ace Company for the years 2015, 2016, and 2017 show an increase from $3.8 million in 2015 to $4 million in 2017. The company’s accounts receivable turnover improved from 4.68 times in 2016 to 5.06 times in 2017, reducing the average payment period from 78 days in 2016 to 72 days in 2017. Additionally, Ace Company saw an increase in cash receipts from $1.8 million in 2016 to $2.547 million in 2017. This trend suggests that as Ace Company continues to boost sales and customers pay their debts more quickly, the likelihood of the company meeting its debt obligations on time improves.
Inventory Turnover
The inventory turnover ratio measures how frequently a company sells and replaces its inventory within a specific period (Fernando, 2022). A low turnover ratio might indicate weak sales and overstocking, while a high ratio could point to strong sales or insufficient inventory. Ace Company operates on a first-in, first-out (FIFO) method, which ensures efficient inventory processing (Marshall, 2020). The company’s inventory increased from $4.8 million in 2015 to $6 million in 2017, aligning with the increase in sales. However, the inventory turnover ratio for Ace Company was 1.94 times in 2016 and 1.82 times in 2017, both significantly below the industry average of ten times per year (Assessment 3, n.d.). The low ratio suggests that inventory remained on hand for 188 days in 2016 and 200 days in 2017, which could indicate that the company is maintaining a higher inventory to meet anticipated sales growth.
Short-term and Long-term Credit Worthiness
Creditworthiness reflects the likelihood of a borrower defaulting on debts and is crucial for lenders when considering new credit lines (Dhir, 2021). Ace Company’s creditworthiness was assessed using its financial statements, current ratio, times interest earned, and debt-to-equity ratio. Typically, a current ratio of 2.0 indicates sufficient liquidity (Marshall, 2020). Ace Company’s current ratio was 1.53 in 2016 and 1.79 in 2017, both below the 2.0 benchmark, but showing improvement in liquidity. The debt-to-equity ratio decreased from 3.78 in 2016 to 2.49 in 2017, signaling improved debt repayment ability. Additionally, the times interest earned ratio, which indicates whether a company has sufficient earnings to cover interest payments, rose from 8 times in 2016 to 10.2 times in 2017, suggesting that Ace Company has enough cash flow to reinvest in the business after settling debts (Chen, 2022).
Recommendation
Based on the analysis of Ace Company’s financial data from 2015 to 2017, I recommend approving the $3 million loan with a ten-year repayment period. The company has shown consistent sales growth and a steady reduction in liabilities over the three years. Although the low inventory turnover ratio is a concern, the increase in sales from 2016 to 2017 suggests that Ace Company may be building inventory to meet expected future sales increases.


Get Capella University Free MBA Samples
HRM FPX 5025
HRM FPX 5122
HRM FPX 5310
LEAD FPX 5210
MBA FPX 5002
LEAD FPX 5220
MBA FPX 5006
MBA FPX 5008
