
RSCH FPX 7864 Assessment 4 Data Analysis and Application Template
Student Name
Capella University
RSCH-FPX 7864 Quantitative Design and Analysis
Prof. Name
Date
Data Analysis and Application Template
Data Analysis Plan
In the current analysis, two variables have been identified: “Section” and “Quiz3.” The variable “Section” represents distinct class sections, while the variable “Quiz3” is continuous and signifies the number of correct answers on Quiz 3. The research question guiding the analysis is formulated as follows: “Is there a significant difference in the performance on Quiz 3 among different class sections?” The null hypothesis posits no significant difference in Quiz 3 performance across class sections, while the alternative hypothesis suggests a significant difference.
Testing Assumptions
Levene’s Test for Equality of Variances
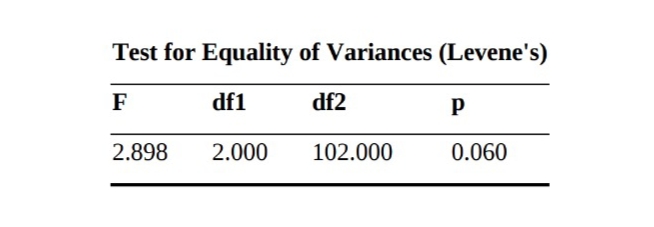
Levene’s test for equality of variances examined the assumption of homogeneity in the data for the analysis of variance (ANOVA). The test produced an F statistic of 2.898, with degrees of freedom for the numerator (df1) equal to 2.000 and degrees of freedom for the denominator (df2) equal to 102.000. The p-value was 0.060. The p-value of 0.060 suggests no evidence to reject the assumption of homogeneity. Therefore, Levene’s test indicates that the assumption of homogeneity is not violated, allowing for the appropriate use of the “none” version of ANOVA for data analysis.
Results & Interpretation
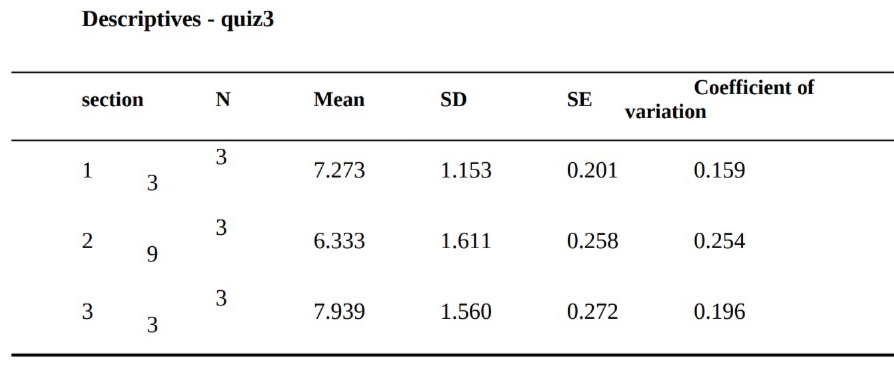
Descriptives – Quiz3 Section
ANOVA – Quiz3
Post Hoc Comparisons – Section

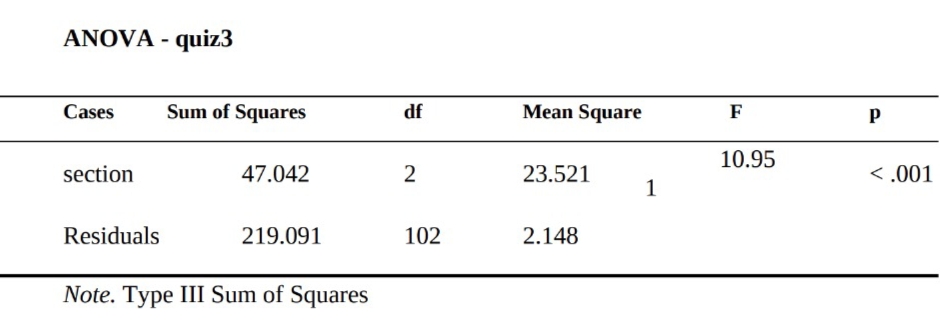
The F test results indicate a significant difference among the three class sections on Quiz 3 (F = 23.521, p < .001). Thus, the null hypothesis is rejected, suggesting differences in quiz scores between the sections. Post-hoc tests using the Tukey method reveal significant differences between sections 1 and 2 (mean difference = 0.939, p = 0.021) and between sections 2 and 3 (mean difference = -1.606, p < .001). However, no significant difference is observed between sections 1 and 3 (mean difference = -0.667, p = 0.159).
In Conclusion
The F test results demonstrate a significant difference in quiz scores among the three class sections. Post-hoc tests reveal specific differences between sections, highlighting variations in performance. While sections 1 and 2, as well as sections 2 and 3, differ significantly, there is no significant difference between sections 1 and 3. These findings suggest performance disparities across class sections on the quiz.
Statistical Conclusions
The ANOVA test analyzed quiz 3 performance among three class sections, revealing significant differences. Post-hoc comparisons showed varying scores between sections. Section 1 outperformed Section 2, while Section 2 outperformed Section 3. These insights can aid in assessing teaching methods and curriculum design effectiveness, guiding resource allocation and educational interventions.
Application
ANOVA is utilized to assess whether means of different sample groups are statistically different. In nursing, ANOVA could be employed to compare the effectiveness of various doses of an anti-depressant on depression scores. For instance, participants could be divided into groups receiving different doses (e.g., 50mg, 100mg, 150mg, 200mg), and depression scores measured using a questionnaire like the PHQ-9. This information is crucial for mental health nurses to determine the most effective anti-depressant dose in treating depressive symptoms.